Conduct and Interpret a Spearman Rank Correlation
What is a Spearman Correlation?
A Spearman correlation coefficient is also referred to as Spearman rank correlation or Spearman’s rho. It is typically denoted either with the Greek letter rho (ρ), or rs. Like all correlation coefficients, Spearman’s rho measures the strength of association between two variables. As such, the Spearman correlation coefficient is similar to the Pearson correlation coefficient.
All bivariate correlation analyses express the strength of association between two variables in a single value between -1 and +1. This value is called the correlation coefficient. A positive correlation coefficient indicates a positive relationship between the two variables (as values of one variable increase, values of the other variable also increase) while a negative correlation coefficient expresses a negative relationship (as values of one variable increase, values of the other variable decrease). A correlation coefficient of zero indicates that no relationship exists between the variables. However, correlation coefficients like Spearman and Pearson assume a linear relationship between variables. Even if the correlation coefficient is zero, a non-linear relationship might exist.
Compared to the Pearson correlation coefficient, the Spearman correlation does not require continuous-level data (interval or ratio), because it uses ranks instead of assumptions about the distributions of the two variables. This allows us to analyze the association between variables of ordinal measurement levels. Moreover, the Spearman correlation does not assume that the variables are normally distributed. A Spearman correlation analysis can therefore be used in many cases in which the assumptions of the Pearson correlation (continuous-level variables, linearity, heteroscedasticity, and normality) are not met.
Typical questions the Spearman correlation analysis answers are as follows:
- Sociology: Do people with a higher level of education have a stronger opinion of whether or not tax reforms are needed?
- Medicine: Does the number of symptoms a patient has predict their willingness to take medication?
- Business: Are consumers more satisfied with products that are higher ranked in quality?
Need help with your analysis?
Schedule a time to speak with an expert using the calendar below.
User Friendly Software
Complete these 3 easy steps:
1. Upload data
2. Select Spearman Correlation and enter variables
3. Download Spearman Correlation results
What You Get:
Interpreted Spearman Correlation results in plain English, complete with APA tables and figures for easy understanding and reporting.
Exclusive Intellectus tool access for 14 days.
Mathematically, the Spearman correlation and Pearson correlation are similar in the way that they use difference measurements to calculate the strength of association. The Pearson correlation uses standard deviations, while the Spearman correlation uses differences in ranks. However, this leads to an issue with the Spearman correlation when tied ranks exist in the sample. An example of this is when two runners tie for second place in a race. In the Spearman correlation analysis, rank is defined as the average position in the ascending order of values. So when two runners tie for second place, this results in one runner with a rank of 1 (first place) and two runners each with a rank of 2.5. The next runner who have a rank of 4. If tied ranks occur, a more complicated formula is used to calculate rho, but SPSS automatically and correctly calculates tied ranks.
Spearman Correlation in SPSS
Suppose we want to answer the research question, “Are letter grades in reading and writing correlated?” We assume that all we have to test this hypothesis are the letter grades (A-F) achieved in reading and writing. Our reading and writing grades (Grade2 and Grade3) are ranked data and measured on an ordinal scale.
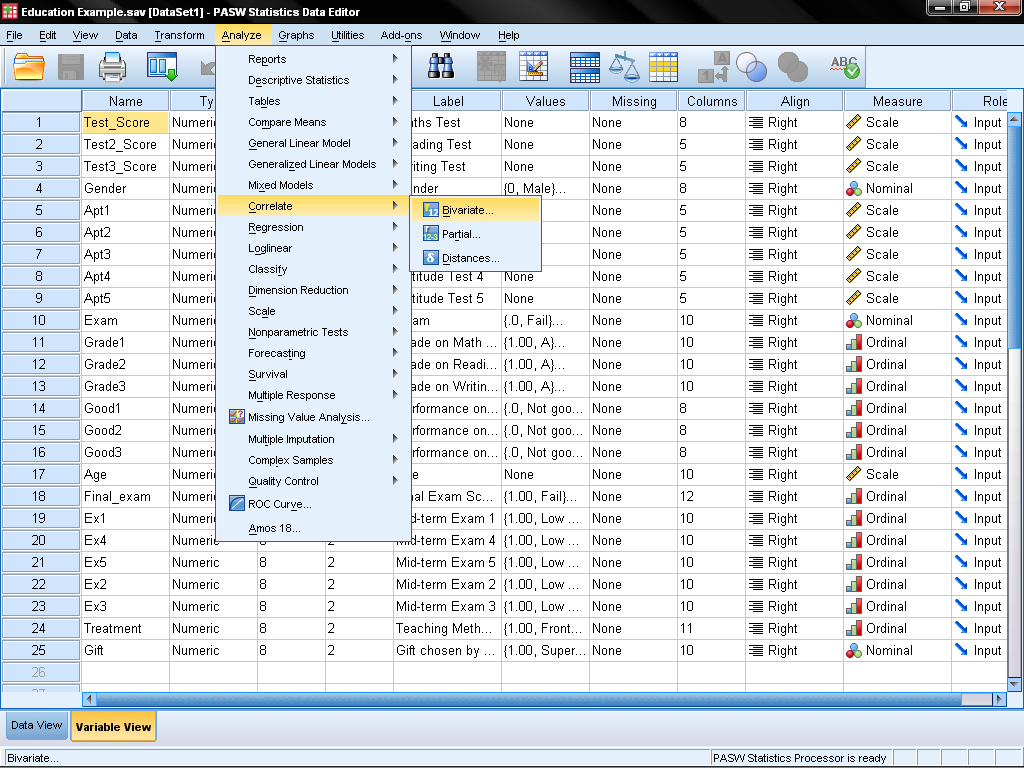
The Spearman correlation can be found in SPSS under Analyze > Correlate > Bivariate…
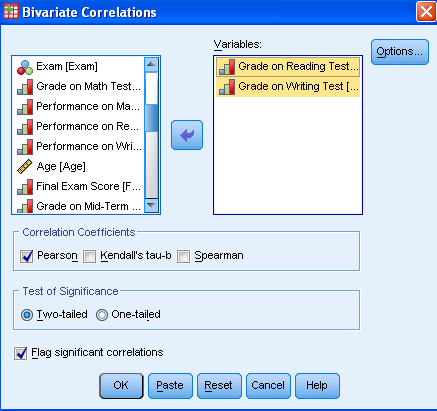
This opens the dialog for all bivariate correlations, which includes Pearson, Kendall’s Tau-b, and Spearman. Using the arrow, we add Grade2 and Grade3 to the list of variables for analysis. Then we need to tick the correlation coefficients we want to calculate. In this case, we want to select Spearman.
Statistics Solutions can assist with your quantitative analysis by assisting you to develop your methodology and results chapters. The services that we offer include:
Edit your research questions and null/alternative hypotheses
Write your data analysis plan; specify specific statistics to address the research questions, the assumptions of the statistics, and justify why they are the appropriate statistics; provide references
Justify your sample size/power analysis, provide references
Explain your data analysis plan to you so you are comfortable and confident
Two hours of additional support with your statistician
Quantitative Results Section (Descriptive Statistics, Bivariate and Multivariate Analyses, Structural Equation Modeling, Path analysis, HLM, Cluster Analysis)
Clean and code dataset
Conduct descriptive statistics (i.e., mean, standard deviation, frequency and percent, as appropriate)
Conduct analyses to examine each of your research questions
Write-up results
Provide APA 6th edition tables and figures
Explain chapter 4 findings
Ongoing support for entire results chapter statistics
Please call 727-442-4290 to request a quote based on the specifics of your research, schedule using the calendar on this page, or email [email protected]

