Understanding Factor Analysis: A Comprehensive Overview
What is the Factor Analysis?
Factor analysis is a sophisticated statistical method used to group and reduce a large set of variables into fewer, more manageable factors or dimensions. This technique is crucial for uncovering latent variables or constructs that are not directly observable but are inferred from the relationships among observed variables. The primary aim of factor analysis is to simplify complex data sets, making them easier to interpret and utilize, particularly in scenarios requiring fewer input variables, such as in regression models.
Key Applications and Techniques of Factor Analysis
Data Simplification and Dimension Reduction: Factor analysis allows researchers to condense numerous individual items into a smaller set of dimensions. This dimension reduction is particularly useful in data simplification, enhancing the clarity and efficiency of subsequent analyses by focusing on essential underlying factors instead of a plethora of individual variables.
Rotation Methods in Factor Analysis: Once factors are extracted, they are often rotated to achieve a simpler, more interpretable structure. There are several rotation methods, including both orthogonal and oblique rotations. Orthogonal rotations, such as Varimax, maintain the factors as uncorrelated, addressing potential issues of multicollinearity in regression analyses. Oblique rotations allow for correlations between factors, which can be more realistic but also more complex to interpret.
Verification of Scale Construction: Factor analysis is instrumental in scale validation and construction. In confirmatory factor analysis, a subtype of factor analysis, researchers specify which items should load on which factors based on theoretical expectations. This method is frequently employed to validate the structure of scales, such as the Big Five personality traits, ensuring that the data fits a predetermined factor structure.
Practical Implementation: Constructing Indices through Factor Analysis
Index Construction: Beyond reducing dimensions and validating scales, factor analysis is commonly used to construct indices. Traditional index construction might involve summing scores of all items. However, factor analysis provides a more nuanced approach by identifying which items contribute most significantly to a construct, allowing for the refinement of indices. For example, in questionnaire development, factor analysis can justify the omission of certain questions to streamline the instrument without sacrificing its psychometric integrity.
Factor Analysis with Examples:
- Educational Research: In educational settings, factor analysis might be used to identify underlying factors that influence student performance, such as motivation, learning strategies, and parental support, based on a wide range of observed behaviors and attitudes.
- Marketing Research: Marketers may employ factor analysis to group consumer preferences or behaviors, thereby creating more targeted marketing strategies that address specific consumer segments.
- Psychological Assessment: Psychologists often use factor analysis to develop or refine diagnostic tools, ensuring that the tests accurately measure distinct aspects of psychological states or traits.
Conclusion
Factor analysis serves as a powerful tool in data analysis, capable of uncovering hidden structures in complex datasets. Whether simplifying data for regression models, verifying the validity of scales, or constructing indices, factor analysis enhances the researcher’s ability to make informed decisions based on condensed and clarified information. Its adaptability across different fields and its ability to handle large sets of variables make it an invaluable method in the arsenal of researchers aiming to derive meaningful conclusions from their data.
EFA help?
Option 1: User-friendly Software
Transform raw data to written interpreted APA results in seconds.
Option 2: Professional Statistician
Collaborate with a statistician to complete and understand your results.
The Factor Analysis in SPSS
The research question we want to answer with our exploratory factor analysis is:
What are the underlying dimensions of our standardized and aptitude test scores? That is, how do aptitude and standardized tests form performance dimensions?
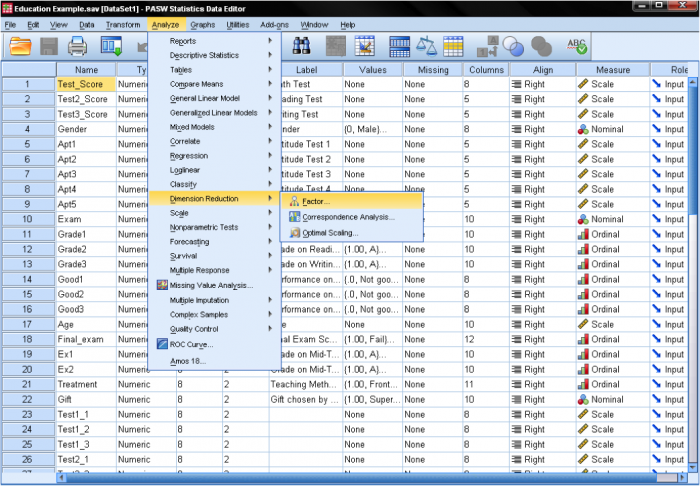
The factor analysis can be found in Analyze/Dimension Reduction/Factor…
In the dialog box of the factor analysis we start by adding our variables (the standardized tests math, reading, and writing, as well as the aptitude tests 1-5) to the list of variables.
In the dialog Descriptives… we need to add a few statistics to verify the assumptions made by the factor analysis. To verify the assumptions, we need the KMO test of sphericity and the Anti-Image Correlation matrix.
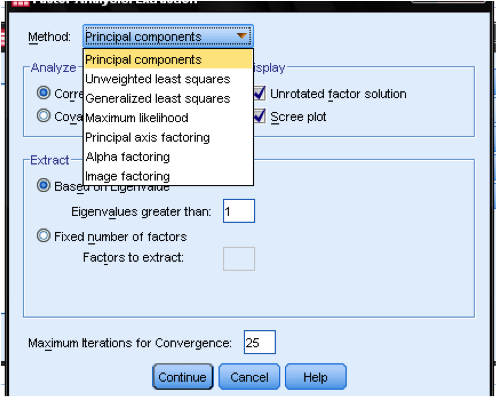
The dialog box Extraction… allows us to specify the extraction method and the cut-off value for the extraction. Generally, SPSS can extract as many factors as we have variables. In an exploratory analysis, the eigenvalue is calculated for each factor extracted and can be used to determine the number of factors to extract. A cutoff value of 1 is generally used to determine factors based on eigenvalues.
Next, an appropriate extraction method need to be selected. Principal components is the default extraction method in SPSS. It extracts uncorrelated linear combinations of the variables and gives the first factor maximum amount of explained variance. All following factors explain smaller and smaller portions of the variance and are all uncorrelated with each other. This method is appropriate when the goal is to reduce the data, but is not appropriate when the goal is to identify latent constructs.
The second most common extraction method is principal axis factoring. This method is appropriate when attempting to identify latent constructs, rather than simply reducing the data. In our research question, we are interested in the dimensions behind the variables, and therefore we are going to use principal axis factoring.
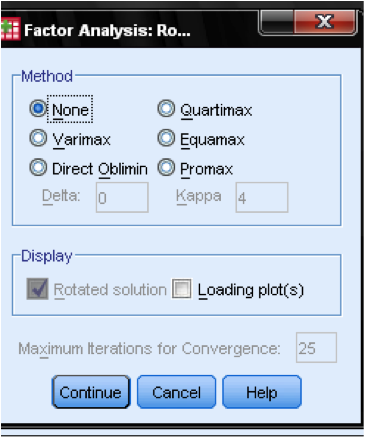
The next step is to select a rotation method. After extracting the factors, SPSS can rotate the factors to better fit the data. The most commonly used method is varimax. Varimax is an orthogonal rotation method that tends produce factor loading that are either very high or very low, making it easier to match each item with a single factor. If non-orthogonal factors are desired (i.e., factors that can be correlated), a direct oblimin rotation is appropriate. Here, we choose varimax.
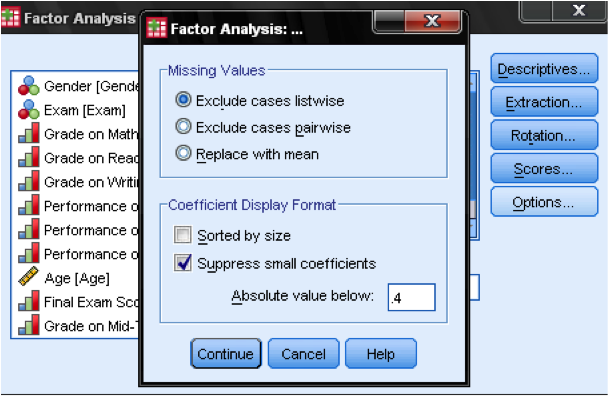
In the dialog box Options we can manage how missing values are treated – it might be appropriate to replace them with the mean, which does not change the correlation matrix but ensures that we do not over penalize missing values. Also, we can specify in the output if we do not want to display all factor loadings. The factor loading tables are much easier to read when we suppress small factor loadings. Default value is 0.1, but in this case, we will increase this value to 0.4. The last step would be to save the results in the Scores… dialog. This automatically creates standardized scores representing each extracted factor.
Statistics Solutions can assist with your quantitative analysis by assisting you to develop your methodology and results chapters. The services that we offer include:
- Edit your research questions and null/alternative hypotheses
- Write your data analysis plan; specify specific statistics to address the research questions, the assumptions of the statistics, and justify why they are the appropriate statistics; provide references
- Justify your sample size/power analysis, provide references
- Explain your data analysis plan to you so you are comfortable and confident
- Two hours of additional support with your statistician
Quantitative Results Section (Descriptive Statistics, Bivariate and Multivariate Analyses, Structural Equation Modeling, Path analysis, HLM, Cluster Analysis)
- Clean and code dataset
- Conduct descriptive statistics (i.e., mean, standard deviation, frequency and percent, as appropriate)
- Conduct analyses to examine each of your research questions
- Write-up results
- Provide APA 7th edition tables and figures
- Explain Chapter 4 findings
- Ongoing support for entire results chapter statistics
Please call 727-442-4290 to request a quote based on the specifics of your research, or email [email protected]


