Conduct and Interpret a Partial Correlation
What is Partial Correlation?
Spurious correlations have a ubiquitous effect in statistics. Spurious correlations occur when two effects have clearly no causal relationship whatsoever in real life but can be statistically linked by correlation. A classic example of a spurious correlation is as follows: Do storks bring babies? Pearson’s Bivariate Correlation Coefficient shows a positive and significant relationship between the number of births and the number of storks in a sample of 52 US counties. Spurious correlations are caused by not observing a third variable that influences the two analyzed variables. This third, unobserved variable is also called the confounding factor, hidden factor, suppressor, mediating variable, or control variable. Partial Correlation is the method to correct for the overlap of the moderating variable. In the stork example, one confounding factor is the size of the county – larger counties tend to have larger populations of women and storks and—as a clever replication of this study in the Netherlands showed—the confounding factor is the weather nine months before the date of observation. Partial correlation is the statistical test to identify and correct spurious correlations.
How to run the Partial Correlation in SPSS
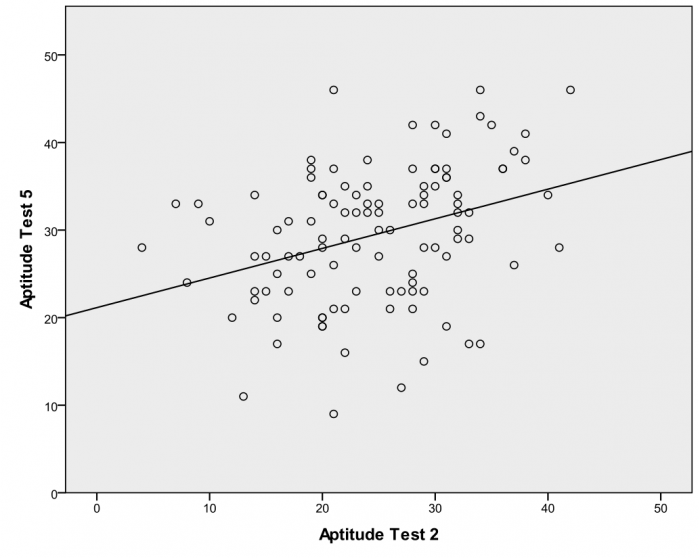
In our education example, we find that the test scores of the second and the fifth aptitude tests positively correlate. However we have the suspicion that this is only a spurious correlation that is caused by individual differences in the baseline of the student. We measured the baseline aptitude with the first aptitude test.
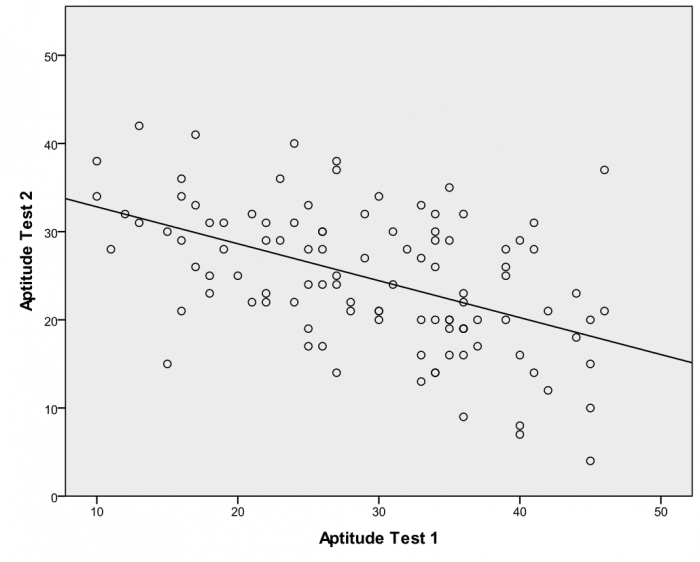
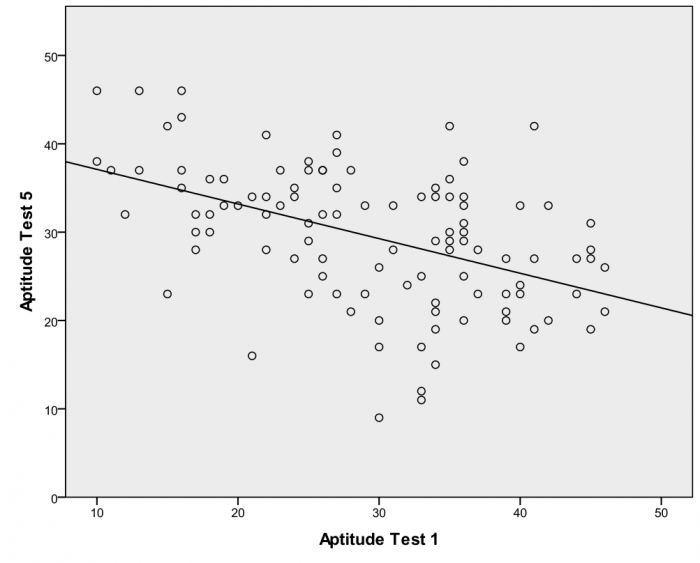
To find out more about our correlations and to check the linearity of the relationship, we create scatter plots. SPSS creates scatter plots with the menu Graphs/Chart Builder… and then we select Scatter/Dot from the Gallery list. Simply drag ‘Aptitude Test 2’ onto the y-axis and ‘Aptitude Test 5’ on the x-Axis. SPSS creates the scatter plots, which clearly shows a linear positive association between the two variables. We can also create the scatter plots for the interaction effects of our suspected control variable Aptitude Test 1. The scatter plots show a medium, negative, linear correlation between our baseline test and the two tests in our analysis.

Discover How We Assist to Edit Your Dissertation Chapters
Aligning theoretical framework, gathering articles, synthesizing gaps, articulating a clear methodology and data plan, and writing about the theoretical and practical implications of your research are part of our comprehensive dissertation editing services.
- Bring dissertation editing expertise to chapters 1-5 in timely manner.
- Track all changes, then work with you to bring about scholarly writing.
- Ongoing support to address committee feedback, reducing revisions.
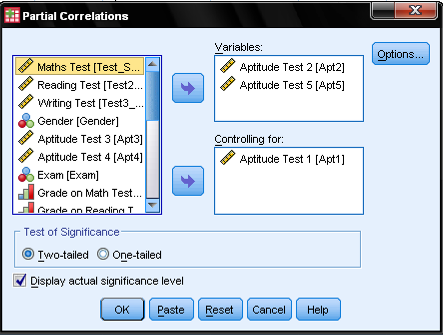
Partial Correlations are found in SPSS under Analyze/Correlate/Partial…
This opens the dialog of the Partial Correlation Analysis. First, we select the variables for which we want to calculate the partial correlation. In our example, these are Aptitude Test 2 and Aptitude Test 5. We want to control the partial correlation for Aptitude Test 1, which we add in the list of control variables.
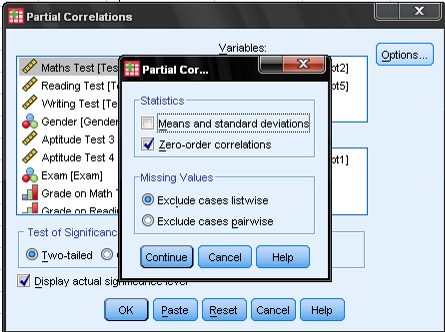
The dialog Options… allows to display additional descriptive statistics (mean and standard deviations) and the zero-order correlations. If you haven’t done a correlation analysis already, check the zero-order correlations, as this will include Pearson’s Bivariate Correlation Coefficients for all variables in the output. Furthermore we can manage how missing values will be handled.
Need More Help?
Check out our online course for conducting a partial correlation here.
