Conduct and Interpret an Independent Sample T-Test
What is the Independent Sample T-Test?
The independent samples t-test is a test that compares two groups on the mean value of a continuous (i.e., interval or ratio), normally distributed variable. The model assumes that a difference in the mean score of the dependent variable is found because of the influence of the independent variable that distinguishes the two groups.
The t-test family is based on the t-distribution, because the distribution of differences in means for a normally distributed variable approximates the t-distribution. The t-test is sometimes also called Student’s t-test. Student is the pseudonym used by W.S. Gosset in 1908 in his published paper on the t-distribution based on his empirical findings on the height and the length of the left middle finger of criminals in a local prison.
The independent samples t-test compares two independent groups of observations or measurements on a single characteristic. The independent samples t-test is the between-subjects analog to the dependent samples t-test, which is used when the study involves a repeated measurement (e.g., pretest vs. posttest) or matched observations (e.g., older vs. younger siblings).

Discover How We Assist to Edit Your Dissertation Chapters
Aligning theoretical framework, gathering articles, synthesizing gaps, articulating a clear methodology and data plan, and writing about the theoretical and practical implications of your research are part of our comprehensive dissertation editing services.
- Bring dissertation editing expertise to chapters 1-5 in timely manner.
- Track all changes, then work with you to bring about scholarly writing.
- Ongoing support to address committee feedback, reducing revisions.
Examples of typical questions that the independent samples t-test answers are as follows:
- Medicine – Has the quality of life improved for patients who took drug A as opposed to patients who took drug B?
- Sociology – Are men more satisfied with their jobs than women?
- Biology – Are foxes in one specific habitat larger than in another?
- Economics – Is the economic growth of developing nations larger than the economic growth of the first world?
- Marketing: Does customer segment A spend more on groceries than customer segment B?
The Independent Samples T-Test in SPSS
Our research question for this independent samples t-test example is as follows:
Does the standardized test score for math, reading, and writing differ between students who failed and students who passed the final exam?
In SPSS, the independent samples t-test is found under Analyze > Compare Means > Independent Samples T Test…
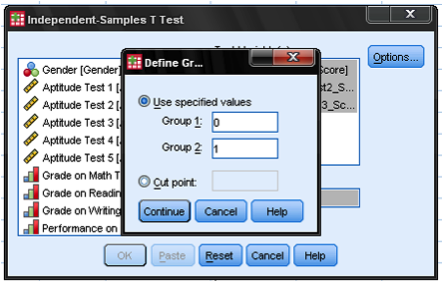
In the dialog box of the independent samples t-test, we select the variables with our standardized test scores as the three test variables; the grouping variable is the outcome of the final exam (pass = 1 vs. fail = 0). The groups need to be defined by clicking on the button Define Groups… and entering the values of the independent variable that distinguish the groups.
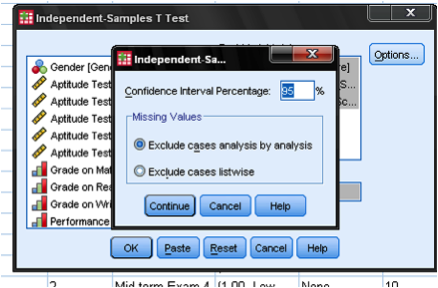
The dialog box Options… allows us to define how missing cases shall be managed (either exclude them listwise or analysis by analysis). We can also define the width of the confidence interval that is used to test the difference of the mean scores in this independent samples t-test.
Statistics Solutions can assist with your quantitative analysis by assisting you to develop your methodology and results chapters. The services that we offer include:
Edit your research questions and null/alternative hypotheses
Write your data analysis plan; specify specific statistics to address the research questions, the assumptions of the statistics, and justify why they are the appropriate statistics; provide references
Justify your sample size/power analysis, provide references
Explain your data analysis plan to you so you are comfortable and confident
Two hours of additional support with your statistician
Quantitative Results Section (Descriptive Statistics, Bivariate and Multivariate Analyses, Structural Equation Modeling, Path analysis, HLM, Cluster Analysis)
Clean and code dataset
Conduct descriptive statistics (i.e., mean, standard deviation, frequency and percent, as appropriate)
Conduct analyses to examine each of your research questions
Write-up results
Provide APA 6th edition tables and figures
Explain chapter 4 findings
Ongoing support for entire results chapter statistics
Please call 727-442-4290 to request a quote based on the specifics of your research, schedule using the calendar on this page, or email [email protected]


