How to Transpose Data in SPSS
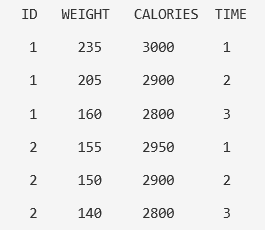
When running repeated measures data, it is necessary to organize the data so that each row represents an individual case. Sometimes in the raw data, the rows will organize as individual measurements for the same cases. The example below represents two participants with two outcome measurements (weight and calories), measured at three different time points. There are two formats for representing repeated measures data: the long and wide format. The long format utilizes multiple rows for each observation:


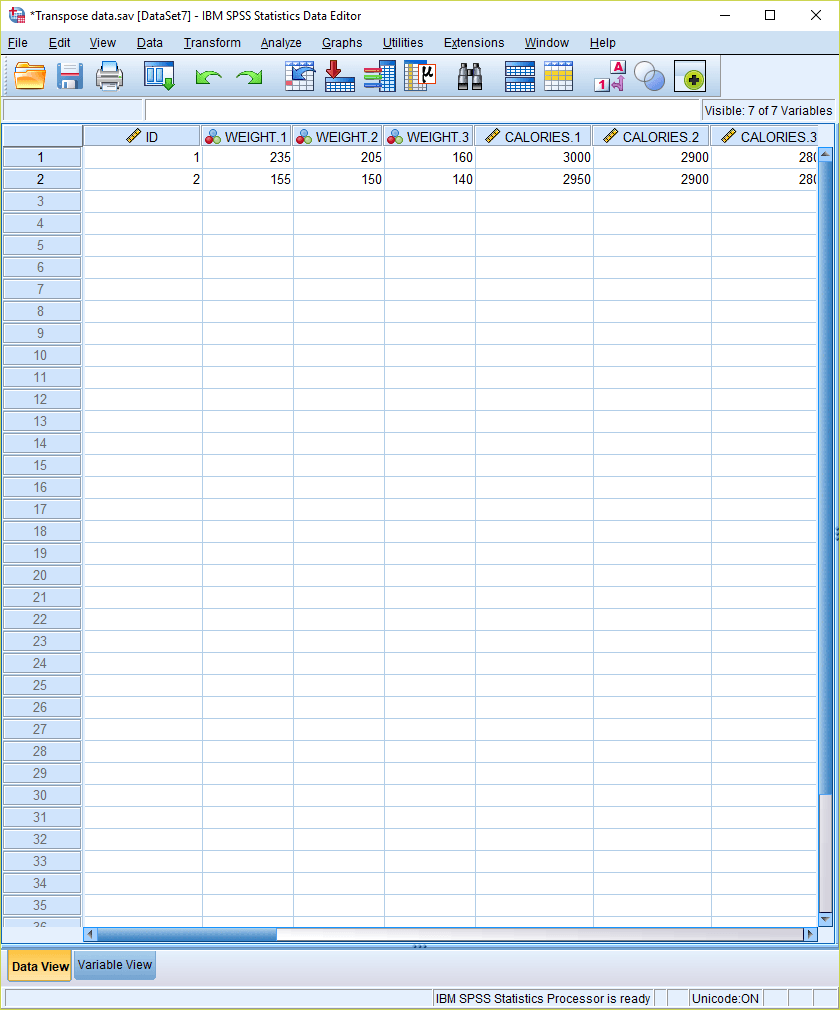
The wide format utilizes one row for each observation or participant:

Using SPSS, the data can restructure from long format into wide format. Here we present the steps for doing this using the above example data.
1) From the Data menu, select Restructure…

2) Then select “Restructure selected cases into variables”.

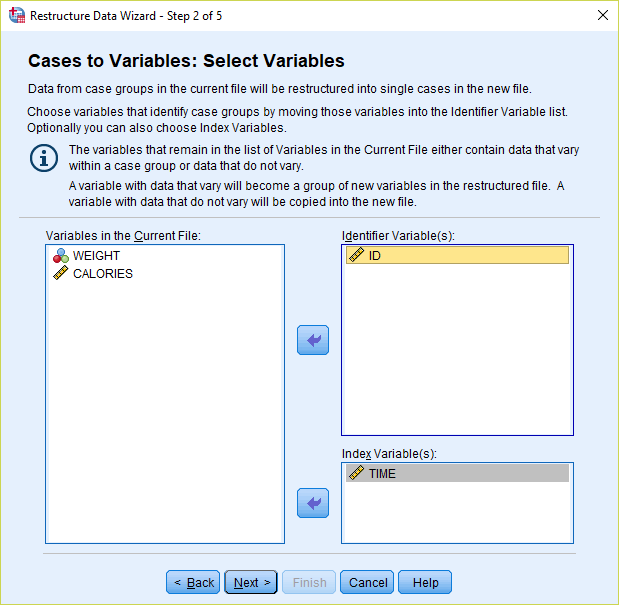
3) For the “Identifier Variable(s)” box, transfer over the ID variable. For “Index Variable(s)”, enter the designator for the repeated measurement (in this case, it is TIME). Then click Next.

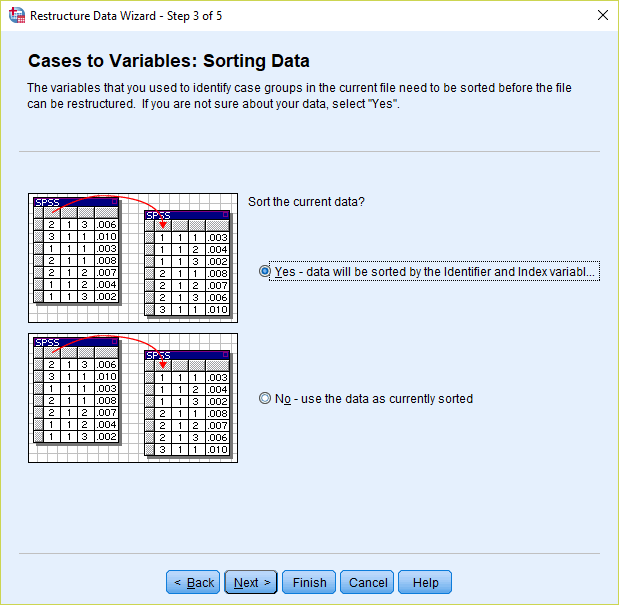
4) Select “Yes” to “Sort the current data”.

5) Click Finish and the data should be restructured to a wide format. Save the file as a transposed version. Note how the variables are automatically given a different name based on the number of measurements. With the data in this format, you can now properly conduct repeated-measures analyses (such as dependent samples t-tests or repeated-measures ANOVAs).


If you’re like others, you’ve invested a lot of time and money developing your dissertation or project research. Finish strong by learning how our dissertation specialists support your efforts to cross the finish line.
