“Dissertations are a marathon, not a race.” “Where there’s a will there’s a way.” “Without sacrifice, there will be no victory.” “That which does not kill us makes us stronger.”
At some point during your dissertation journey, you’ve either heard some of these clichés or even said them internally. Particularly, in trying to find your dissertation motivation. Subsequently, the dissertation process is a lonely and lengthy journey and it’s normal to find yourself procrastinating. If you’re an ABD (all-but-dissertation) student, the dissertation is the last hurdle left between you and graduation, and now is the time to sprint, jump, and reach the finish line! Moreover, this month we’re sharing a few tips to keep you motivated and moving forward.
Potential Dissertation Roadblocks
Some things are not in your control. Likewise, some faculty and chairs will want you to go through the same scholarly writing paces. They went through, which means you may be addressing a lot of feedback or rewriting a lot of your work. Make sure you understand their feedback so you’re not caught in a loop of revisions. Some students are very comfortable writing the literature reviews. But others struggle with the results, these can be good places to reach out for help. Get ahead of the curve by looking at a dissertation. Therefore, it closely relates to yours or even ask your committee members for dissertations they’ve accepted in the past.
Need assistance with your research?
Schedule a time to speak with an expert using the link below.
Let’s Talk Responsibility
Everything good and everything bad in your life has one common attribute – You. We are not victims of the dissertation process or of uncooperative chairs. In the spirit of reaching the finish line, let’s throw all pretenses and excuses out the window! Let’s be responsible for setting our dissertation goals and making sure we accomplish them. Check in with your chair periodically if they’re taking too long to review your chapter, hire a statistician if you’re uncomfortable with statistics, or reach out to your peers (they’re going through the same process!).
Research Takes Time
There is no “quick-fix” for research. Research takes time, editing takes time, and committees can drag their feet. We often speak with students who need something edited and returned in 2 days or they need to graduate in a few months. It’s these students that bear the financial burden when they don’t graduate on time. Keep things moving forward by making short and long-term personal deadlines that keep you on track. For example, if your committee member provides feedback that seems massive, give yourself a longer deadline for extensive feedback and give yourself a shorter deadline for easy feedback. Remember, never stop making progress!
Remember – most likely, this is your first and will be your only dissertation, so know your strengths and reach out for help when you need it.
Yours in Dissertation Success,
The Statistics Solutions Team
When is it time to get serious about our progress? As Jim Rohn, motivational speaker and author of ‘Take Charge of Your Life’ used to say, it’s all about “making measurable progress in reasonable time.” The time needed to conveniently complete the required tasks is a reasonable time. But what does that mean when it comes to the dissertation process? Is it reasonable to spend an entire semester going back and forth with your chair over feedback? How about spending a semester learning how to use complicated statistical software, just to realize you don’t know how to interpret the output? Our guess is that neither of those scenarios is very reasonable. However, every day, we meet graduate students who struggle with the same chapter or round of feedback for months!
So, how do we break the vicious cycle of wasting time? Our motto is: results matter most! Practically, this means that if you spend a year working on your dissertation and are still struggling to get your Introduction chapter approved, your research is ineffective. The time being spend is unreasonable and your time is not yielding results that matter.
To begin making strides towards measurable progress while improving efficiency; rely on experts to help. Visit your University’s Student Center, consult your Librarian, explore free dissertation resources, and seek help when needed. Remember, the goal is to always “make measurable progress in a reasonable time.”
Yours in Dissertation Success,
The Intellectus Consulting Team
[/et_pb_row][/et_pb_section]
Happy New Year; now let’s talk responsibility!
Everything good and everything bad in your life has one common attribute—You. We are not victims of mean bosses, inattentive advisors, uncivilized children, genetics…. All excuses, pretense, and denial—out the window it goes!
There’s an old story about three brick layers. When the first was asked what he was doing, he said, “I don’t know, I hate my job.” The second man said, “I am feeding my family and supporting their education.” The third man said, “I am building a cathedral that will stand for 1000 years.” The men were doing the same job, yet their experiences differed. Who do you think did a better job? Who was happiest? Who would live longest? See, it’s our job to go and make the life we want.
Most of you reading this newsletter hold the vision of completing your dissertation or project. You’re going to be a PhD, EdD, DBA, PsyD, etc. You need to hold that space right now to get there. Act like the person you will become right now.
And for most of you doing a quantitative study, statistics means dread. It doesn’t have to! Did you know that we have expert statisticians that walk you through conducting and interpreting your results, providing an APA formatted results chapter in 1 hour (not 1 month)?
In this New Year, I wish you total responsibility, building of cathedrals, your degree completion, and we will provide the quantitative support to get there.
You can schedule a free, no obligation consultation by clicking the link below.
Best,
James Lani, PhD
![]()
[/et_pb_text][/et_pb_column][/et_pb_row][/et_pb_section]
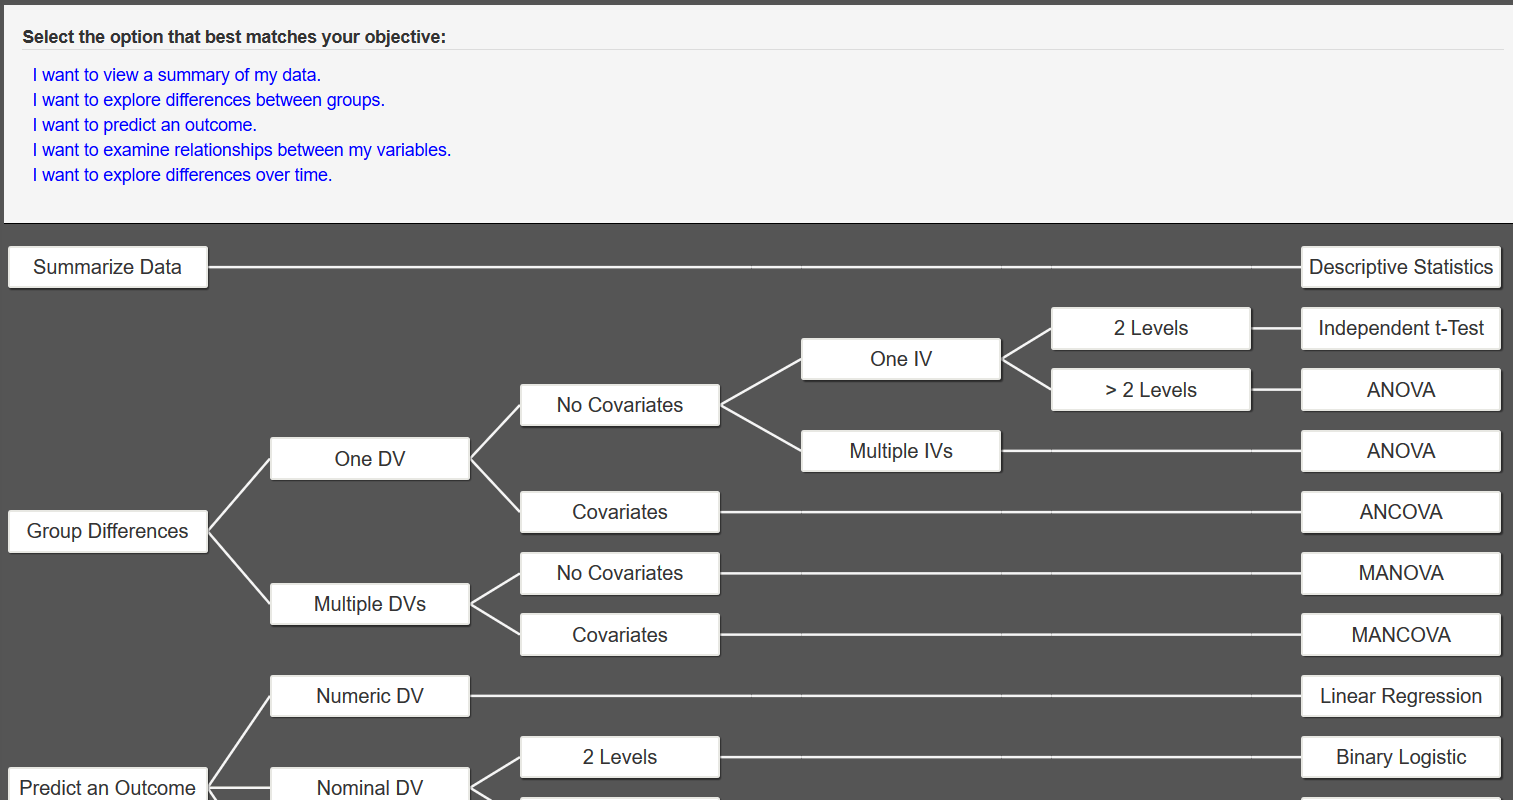
Decision trees are handy tools that can take some of the stress out of identifying the appropriate analysis to conduct to address your research questions. A decision tree is a visual organization tool that outlines the type of data necessary for a variety of statistical analyses. It is important to note that decision trees, such as the one included in our Intellectus Statistics software, cover the more common and basic statistical analyses (e.g., t-tests, ANOVAs, and regressions) and may not be appropriate for more sophisticated analyses.
For example, consider the following research question: Are there differences in starting salary for executives in Fortune 500 companies by highest degree earned and previous position? In this example, highest degree earned is a categorical variable with categories of bachelor, master, and doctoral. Previous position is a categorical variable with categories of entry level, mid-level management, and high-level management. Treat the highest degree earned and previous position as categorical independent variables. Operationalize starting salary as the dollar amount new hires accept upon beginning employment. Treat starting salary as a continuous dependent variable.
Need help conducting your analysis? Leverage our 30+ years of experience and low-cost service to complete your results!
Schedule now using the calendar below.
Following the Intellectus Statistics decision tree, for the first decision you would select I want to explore differences between groups.
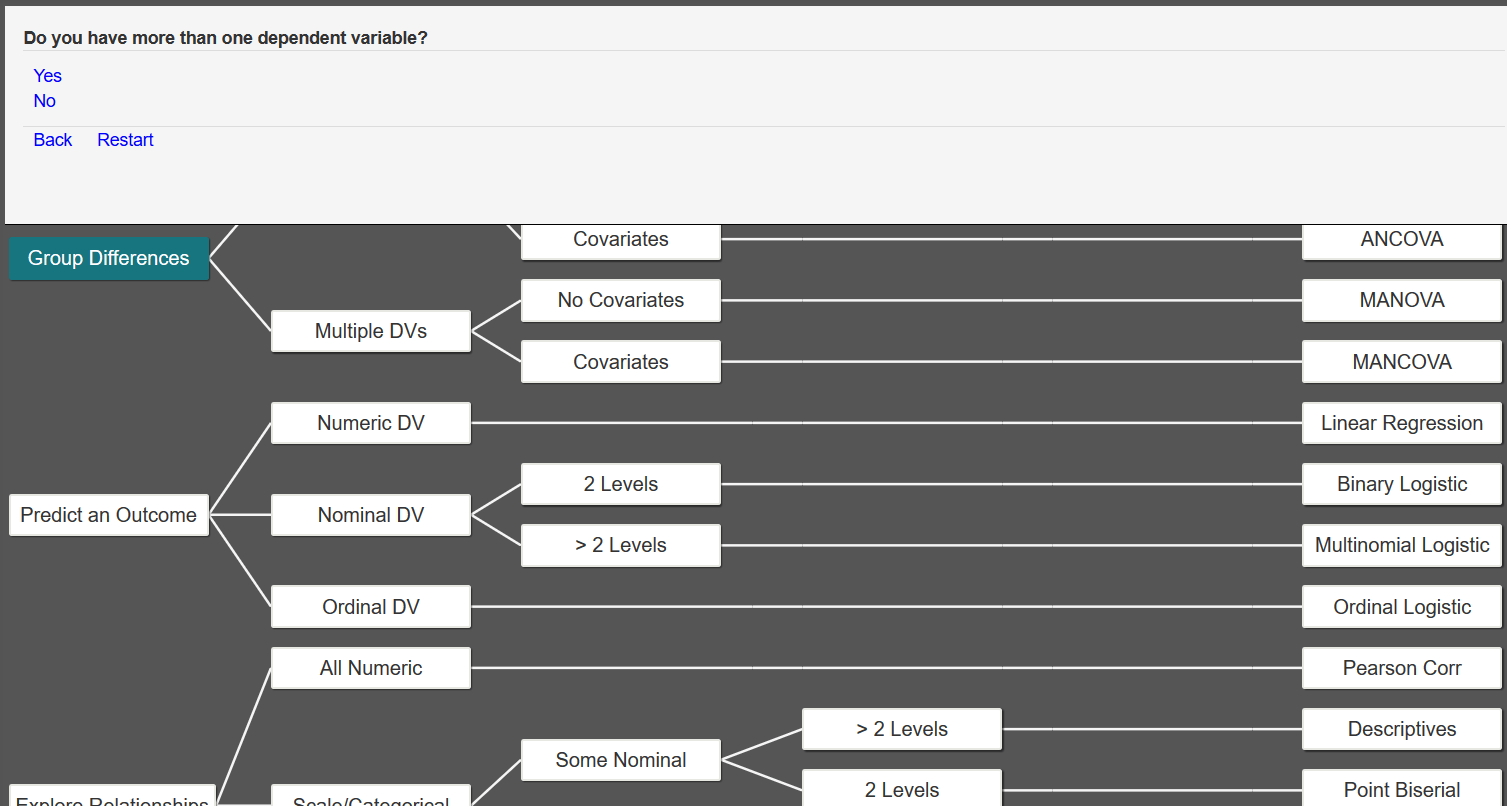
The next question asks if you have more than one dependent variable. Because our only dependent variable is starting salary, we would select No.
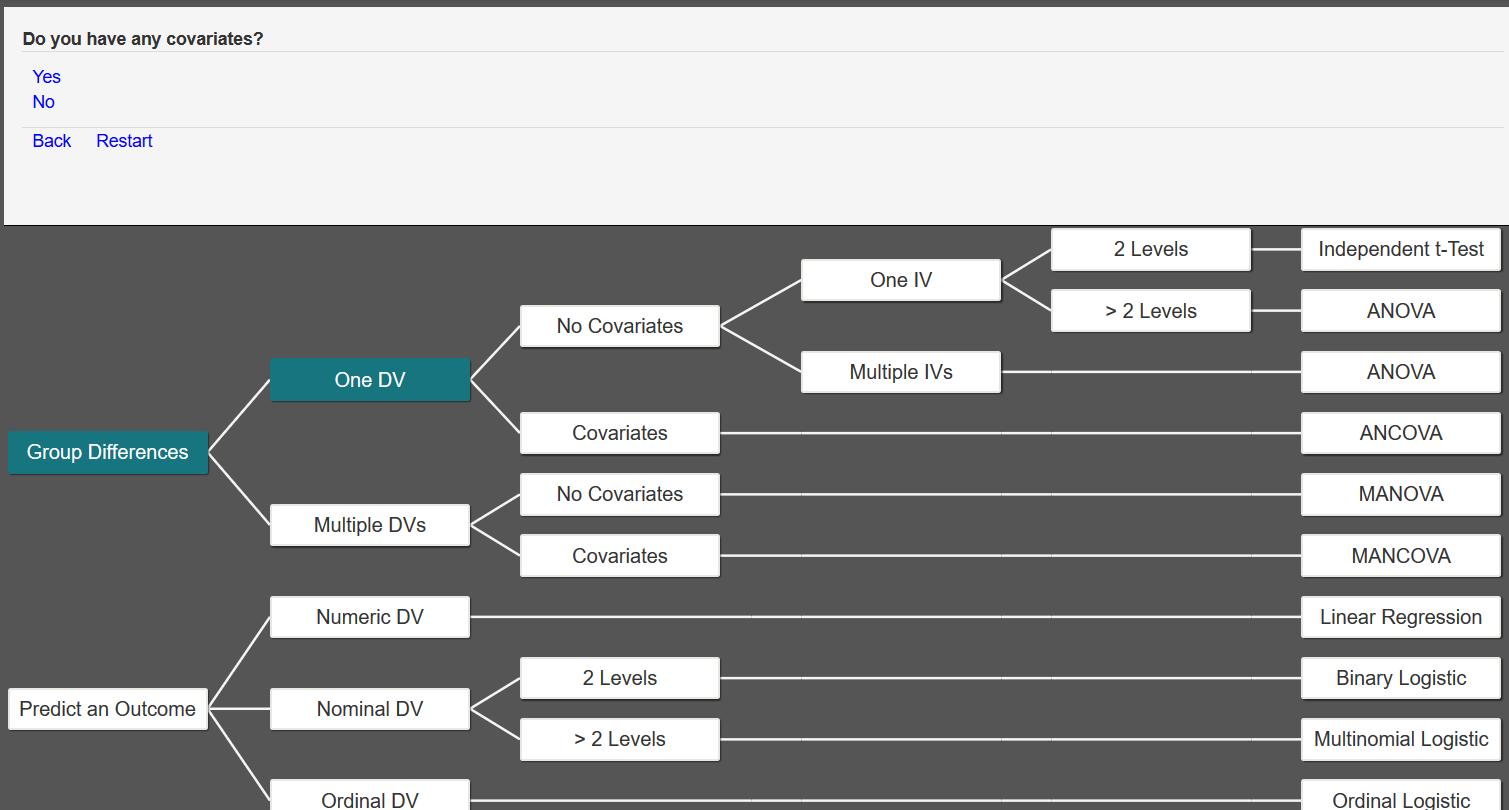
For the next question, we have no covariates, so we would answer No.
Next, we are asked if we have more than one independent variable. Because we have two independent variables (highest degree earned and previous position), we select Yes.
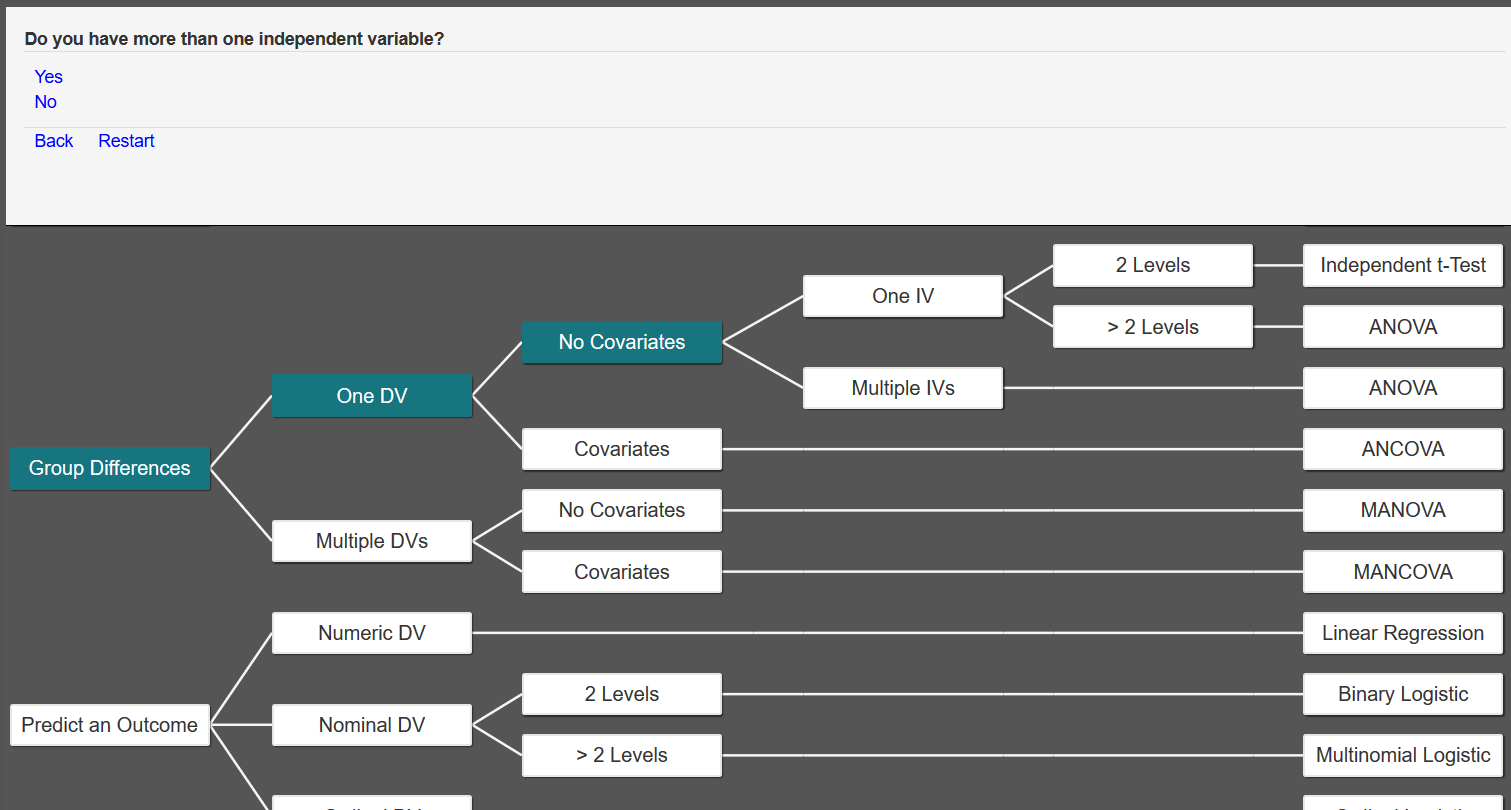
At this point, the decision tree has reached the conclusion that we should conduct an ANOVA.

Intellectus Statistics simplifies decision-making with tools for planning, justifying, and determining participant numbers. For assistance with our software and a variety of other dissertation resources, please contact us!
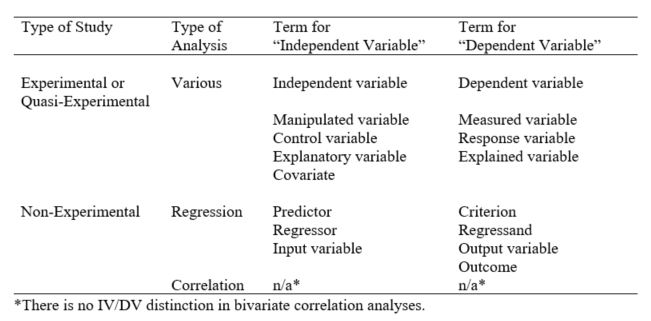
In the research world, you may find that there are many ways to refer to the same thing—and that is certainly true when it comes to variable designations. Independent, dependent, predictor, criterion—it can be hard for the novice researcher to keep these terms straight! Here we will try to provide some clarity on variable names.
The most common and general labels used to refer to variables in quantitative research are independent (IV) and dependent (DV). In a classic experimental sense, your IV is the variable you manipulate (think: new drug vs. placebo). It is called independent because, ideally, you want to determine the isolated or “unique” effect of this variable on your outcome. Your DV, on the other hand, is the outcome you want to measure (think: number of cancer cells present after treatment with new drug vs. placebo). It is dependent on your independent variable (if your experiment works). The amount of cancer cells present depends on what treatment (drug) is being administered.

Your IV might also be the variable you are trying to find differences between (think: gender differences), or relationships with your dependent variable. In a strict sense, independent and dependent variables are the correct nomenclature for a classic experimental study. But here is something to think about: if the independent variable is the one you manipulate, and you are not manipulating any variables in your research, can you still really call it an independent variable? Schools, advisors, and committees will all have different opinions on what terminology to use. Independent and dependent are the most commonly understood terms. However, here are some other common designations based on type of analysis and study:
Many students struggle to find the right theory to use for their dissertation. In this blog series, we highlight the most popular theories we come across in our work with doctoral students. Just be aware that these are merely theory overviews and are in no way all encompassing. These overviews are designed to give you some familiarity with major theories that you might consider using.
Theory: Thornberry’s (2006) model of entrepreneurial leadership
Thornberry’s (2006) model of entrepreneurial leadership is rooted in combining facets of transformational, transactional, and charismatic leadership styles to develop an integrated approach to leadership. Within this combination is entrepreneurial leadership, which can be broken into five distinct dimensions: general entrepreneurial leader behavior (GELB), explorer behavior (EXPB), miner behavior (MINB), accelerator behavior (ACCB), and integrator behavior (INTB).
GELB is how leaders provide followers with an environment wherein followers’ innovation, behaviors, and accomplishments are supported as being part of overall job duties. EXPB deals with the ability of the entrepreneurial leader to recognize new opportunities and embrace them to increase organizational creativity and performance. MINB occurs when leaders expand the competitive advantage of their organizations by applying innovative approaches to people, procedures, and processes. ACCB allows for leaders to use their skills and focus to encourage their followers to embrace innovative behaviors and thinking, allowing a creative environment to be developed for subordinates. Finally, INTB characterizes leaders who are inherently innovative and creative thinkers, who then apply their mindset throughout their organization by effectively communicating how innovation furthers the organization’s goals. As such, Thornberry’s model provides an assessment in how entrepreneurial leaders apply innovation, proactivity, and risk-taking abilities in the execution of their work tasks.
This theory is best suited for studies on:
- Leadership
- Management
- Mentorship
- Organizational psychology
Further reading:
Thornberry, N. (2006). Lead like an entrepreneur: Keeping the entrepreneurial spirit alive within the corporation. Fairfield, PA: McGraw Hill.
Missing data can pose issues to your statistical analyses, and your committee may offer multiple ways to address the issue of missing data. While some committee members may prefer imputation to replace missing data, other committee members may offer deletion to address missing data. Pairwise and listwise deletion may be implemented to remove cases with missing data from your final dataset. Prior to using deletion, it is important to note that pairwise and listwise deletion can be used when you are dealing with data that is missing at random. Non-random missing data may require other methods for correction.
Researchers using listwise deletion will remove a case completely if it is missing a value for one of the variables included in the analysis. For example, say you are conducting analyses using cumulative high school GPA, hours of study for first semester, SAT score, and first semester grade in college algebra. Participant X is missing data for cumulative high school GPA, therefore, Participant X will be completely removed from the analyses because the participant does not have complete data for all the variables.
Researchers using pairwise deletion will not omit a case completely from the analyses. Pairwise deletion omits cases based on the variables included in the analysis. As a result, analyses may be completed on subsets of the data depending on where values are missing. For the example listed above, Participant X will be omitted from any analyses using cumulative high school GPA, but they will not be omitted from analyses for which the participant has complete data.
Researchers using listwise deletion may have to contend with losing large amounts of data due to missing cases. Researchers using pairwise deletion may have challenges with drawing inferences to the total sample. Results in analyses using pairwise deletion may be based on subsets of cases with complete data. The patterns identified in the analysis may not hold for the complete dataset because the analysis only includes a portion of the dataset.
Need help with your project? Leverage our 30+ years of experience and low-cost service to make progress on your results!
Schedule now using the calendar below.
For assistance with these issues or any other questions you have, you can always reach out to Intellectus Consulting for assistance. Our mentors are here to help you move your project forward!
Dissertations typically require a theoretical or a conceptual framework to ground your research in existing concepts. However, it can be difficult to determine which framework you should use. In this blog series, we highlight popular theories to help you determine which theories best fit your dissertation.
Theory: Maslow’s (1943) hierarchy of needs
In 1943, Abraham Maslow developed a theory on the hierarchy of human needs. Maslow’s hierarchy is often depicted as a pyramid- much like in a food pyramids where more important food groups are at the bottom of the pyramid and lesser or unnecessary groups are further to the top. There are five “needs” in the pyramid of Maslow’s hierarchy, and the needs ascend from the most basic human needs to higher level needs. Maslow termed the five levels of need physiological, safety, love/belonging, esteem, and self–actualization. Maslow separated the needs into two groups: physiological, safety, love/belonging, and esteem are all deficiency needs; individuals must satisfy all of their deficiency needs before they can achieve self-actualization. Self-actualization is a growth need, and Maslow indicated that achieving this is the ultimate goal of the hierarchy of needs. Deficiency needs may include food, water, and shelter; while growth needs may include goal attainment and personal growth.
Maslow’s hierarchy of needs can be a useful framework for your research if you are intending to study human motivation or behavior. Typically, as per Maslow’s hierarchy, individuals’ levels of motivation will decrease as they meet deficiency needs. However, motivation will increase as they achieve growth needs. The satisfaction of varying deficiency and growth needs influences human behavior, as individuals will act accordingly if they have needs that are not being met.
Need help with your project? Leverage our 30+ years of experience and low-cost service!
Schedule now using the calendar below.
Further reading:
Maslow, A. H. (1943). A theory of human motivation. Psychological Review, 50(4), 370-396.
Normality is a common assumption in statistical analyses, with most parametric tests requiring it. Normality in regression refers to the error distribution, not individual variables. However, it’s easier to meet the assumption if each variable is normally distributed.. Let’s look at how we can make that happen.
Often one of the first steps in assessing normality is to review a histogram of the variable in question. In this format, the X axis shows a variable’s values. And, the Y axis represents the number of participants with each value. A normal distribution has most of the participants in the middle, with fewer on the upper and lower ends – this forms a central “hump” with two tails. It should look something like this:
Need help conducting your analysis? Leverage our 30+ years of experience and low-cost same-day service to complete your results today!
Schedule now using the calendar below.
Sometimes, though, this is not what the data look like. A possible way to fix this is to apply a transformation. Transforming data is a method of changing the distribution by applying a mathematical function to each participant’s data value. If you have run a histogram to check your data and it looks like any of the pictures below, you can simply apply the given transformation to each participant’s value and attempt to push the data closer to a normal distribution.
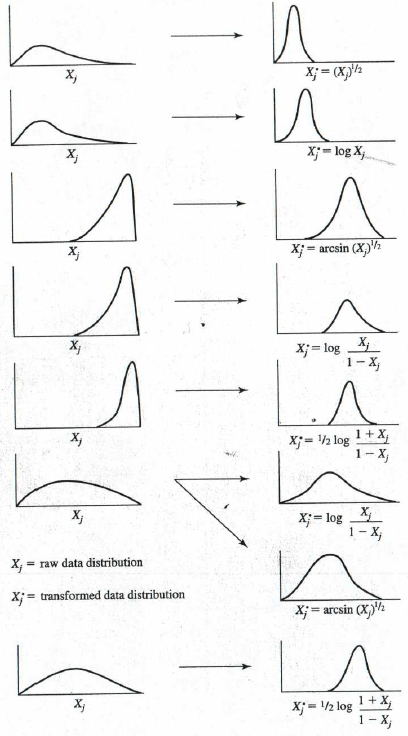
Figure from Stevens (2002) Applied Multivariate Statistics for the Social Sciences 5th ed.
For example, if your data looks like the top example, take everyone’s value for that variable and apply a square root (i.e., raise the variable to the ½ power). This is easy to do in a spreadsheet program like Excel and in most statistical software such as SPSS. You can then check the histogram again to see how the new variable compares to a normal distribution.
However, keep in mind that there is a bit of a tradeoff here. Your data may now be normal, but interpreting that data may be much more difficult. For example, if you run a t-test to check for differences between two groups, and the data you are comparing has been transformed, you cannot simply say that there is a difference in the two groups’ means. Now, you have the added step of interpreting the fact that the difference is based on the square root. For this reason, we usually try to avoid transformations unless necessary for the analysis to be valid.
For analyses like the F or t family of tests (i.e., independent and dependent sample t-tests, ANOVAs, MANOVAs, and regressions), violations of normality are not usually a death sentence for validity. As long as the sample size exceeds 30 (even better if it is greater than 50), there is not usually too much of an impact to validity from non-normal data; something that Stevens stressed in his 2016 publication of Applied Multivariate Statistics for the Social Sciences.