How to Set Up Pretest/Posttest Data that Cannot be Matched
Many doctor of nursing practice (DNP) students use Pretest/Posttest data designs for their doctoral projects. In a pretest/posttest design, participants complete an assessment before engaging in an intervention or training program (i.e., the pretest). Then, participants complete the same assessment after the program (i.e., the posttest). Researchers compare the scores on the pretest and posttest assessments to determine if the program led to an improvement.
In a previous blog we showed how to set up matched pretest/posttest data for analysis in statistical software programs such as SPSS and Intellectus Statistics. Situations often arise where the pretest and posttest responses cannot be matched. For example, when measuring patient outcomes, the group of patients assessed during the posttest period may differ from those assessed during the pretest period, as patients are continually admitted and discharged. When the pretest and posttest data come from completely different people, you cannot match the data.

Another example would be if you collected pretest and posttest data within the same nursing unit using an anonymous survey. Some (or all) of the nurses who completed the pretest may have also completed the posttest. If you didn’t assign identification codes or collect identifying information (like names or emails), you can’t match the data.
If you cannot match your pretest/posttest data, you must set up and analyze the data differently. This blog shows how to handle unmatched (independent samples) data in SPSS and Intellectus Statistics.
In this example, five participants completed the pretest, and five different participants completed the posttest. Both tests included three questions (Q1, Q2, and Q3) answered on a 1 to 5 Likert scale. The first image below shows what the data should look like in SPSS’s “Data View.”
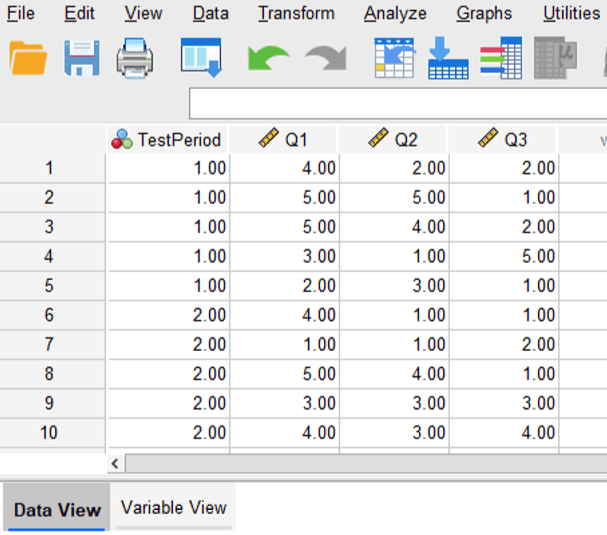
First, notice that we have 10 rows of data corresponding to our 10 participants (five pretest participants and five posttest participants). The columns labeled “Q1” “Q2” and “Q3” contain the participants’ responses to the assessment. Enter each participant’s responses across the same row.
The column labeled “TestPeriod” contains a numerical code to designate whether the participant responded during the pretest phase or the posttest phase of the project. In this example, a value of 1 corresponds to a pretest response, and a value of 2 corresponds to a posttest response. Notice that five rows have a value of 1 for this variable (designating the five pretest responses), and the other five rows have a value of 2 for this variable (designating the five posttest responses). To make it clear what these values represent when we run the analysis, we can assign labels to these values in the SPSS Variable View as shown in the image below.
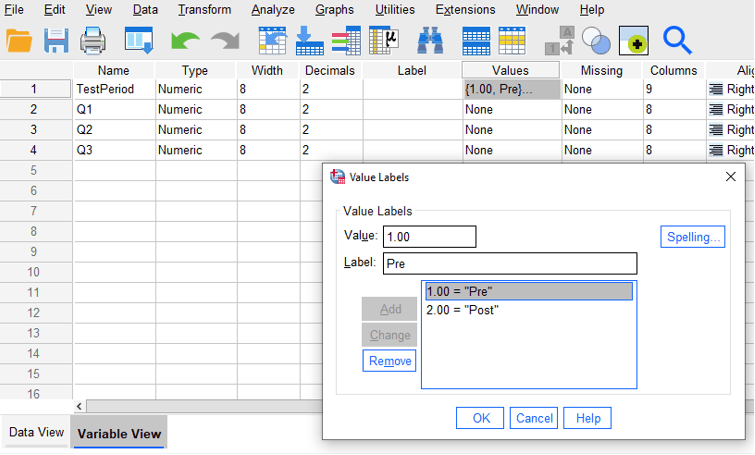
In Variable View, click the “Values” cell to assign labels like “Pre” and “Post” to numerical values.
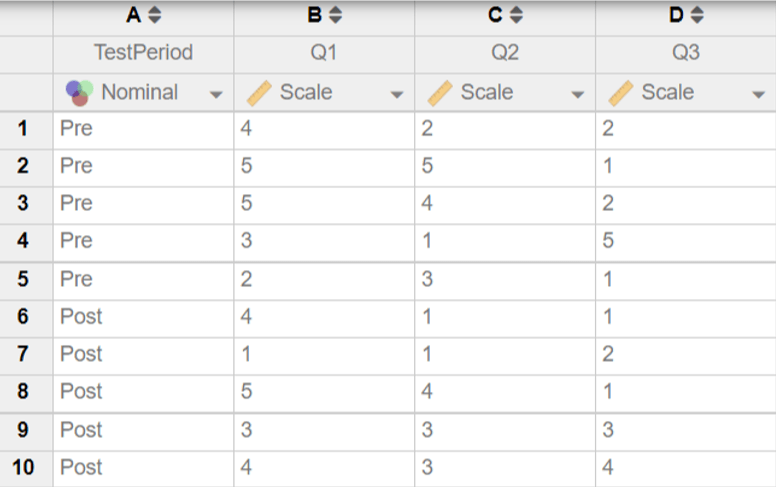
The next image below shows how the same data should look when entered in Intellectus Statistics. Notice how the structure of the data is the same as it was in SPSS. Column A contains the TestPeriod variable with labels “Pre” and “Post,” while columns B-D hold responses to three assessment questions.
After setting up the data, compute composite scores or run analyses using an independent samples test for unmatched data.

We work with graduate students every day and know what it takes to get your research approved.
- Address committee feedback
- Roadmap to completion
- Understand your needs and timeframe

If you’re like others, you’ve invested a lot of time and money developing your dissertation or project research. Finish strong by learning how our dissertation specialists support your efforts to cross the finish line.